

Cell Browser: Visualize single-cell clustering data

PluriTest: Check for Pluripotency
Pgltools: Manipulate Hi-C and ChIA-PET data
SCIMITAR: Single Cell Inference of MorphIng Trajectories and their Associated Regulation
Tag Storm: Metadata made simple
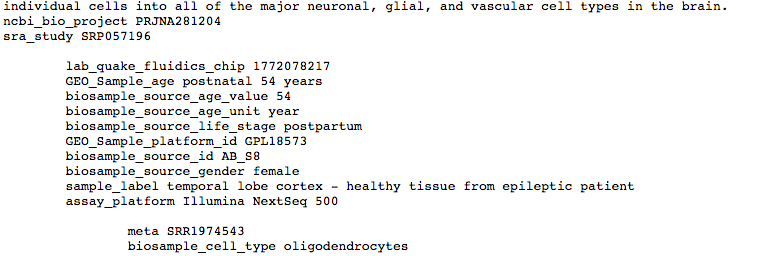
The tag storm format offers an easy way to describe a hierarchical set of metadata for your data. The tag storm format is made up of a number of key/value pairs spread across stanzas at various indentation levels. Lower indentation levels inherit information from higher levels, so the most general metadata, e.g. lab or dataset names, are generally found at the highest level and more specifc metadata, e.g. sex or file name, are found at the lower level.
The Tag Storm GitHub page contains more information about the format as well as a suite of tools to work with and manipulate tag storm files.
RIGGLE: Regulator Inference by Graph-Guided LASSO Estimation
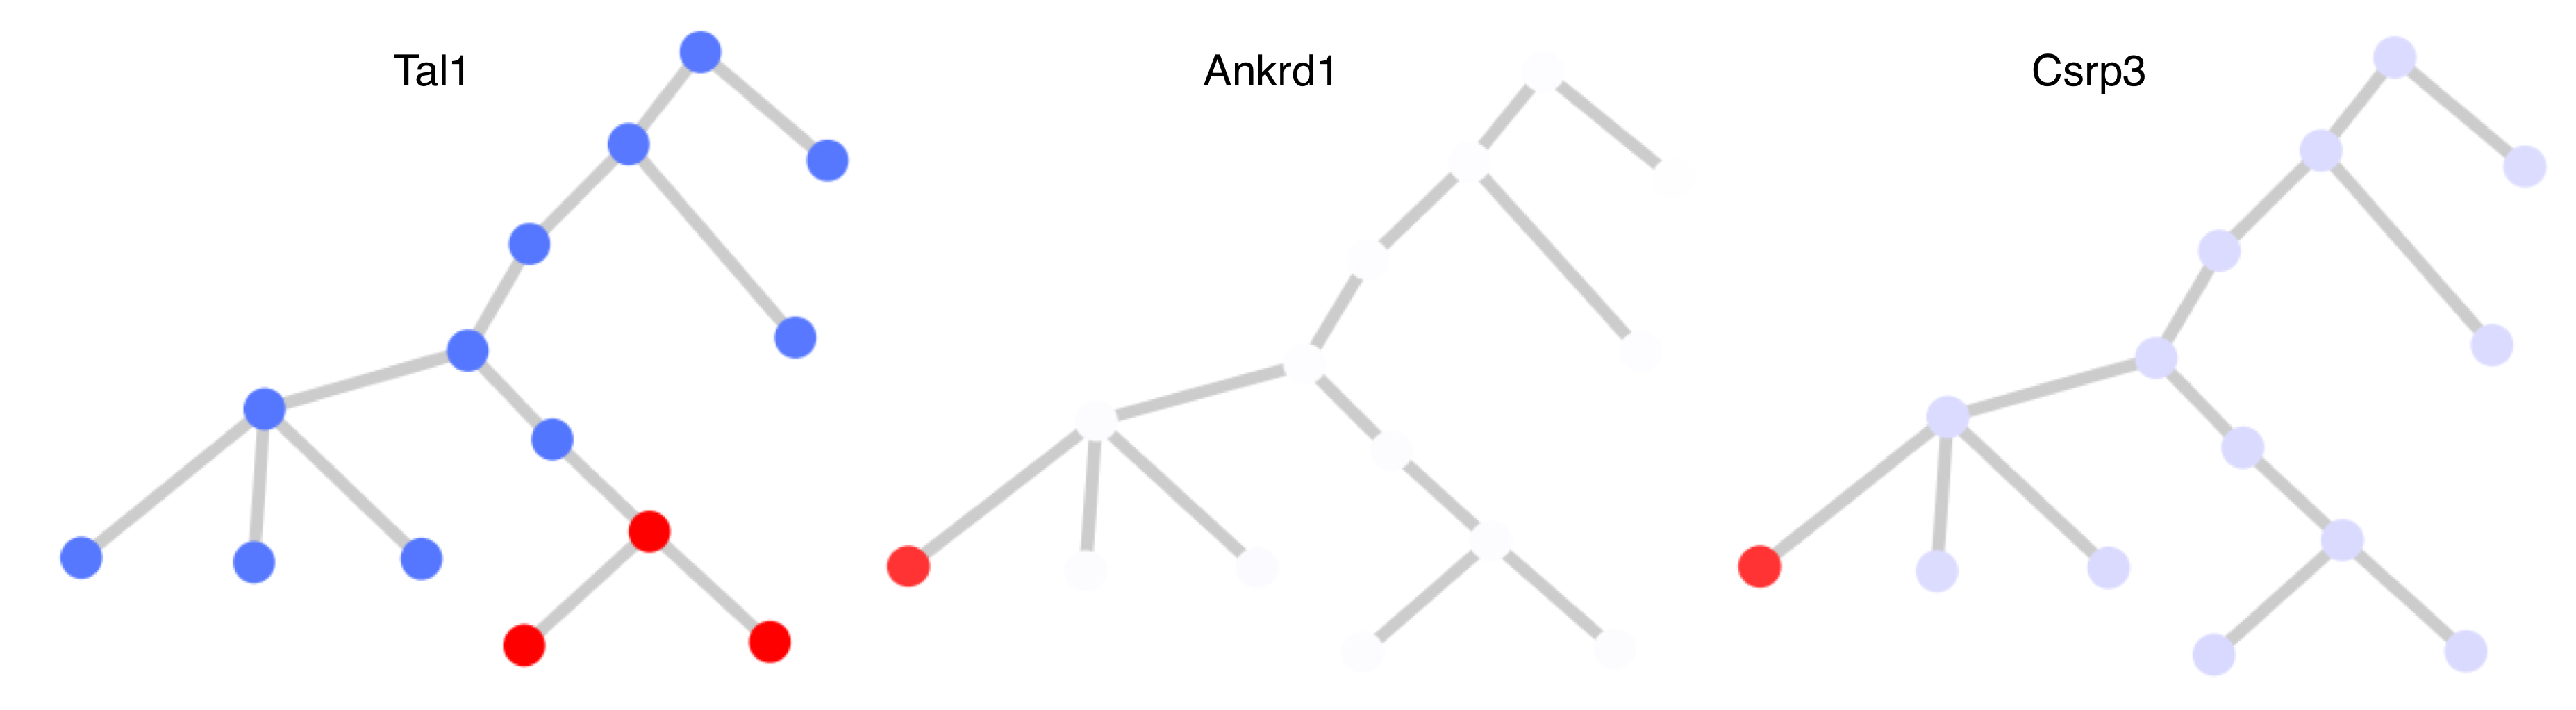
RIGGLE (Regulatory Inference by Graph-Guided LASSO Estimation) is a machine learning framework designed to discover the transcription factor regulators of a cell development trajectory by taking in expression data, known transcription factor targets, and a cell development graph.
This process produces predictions for the transcription factor's activities in each of the cell types represented in the graph based on the coordinated expression of its targets, while respecting the developmental relationships between the cells.
UCSC Cell Atlas
The UCSC Cell Atlas is a growing compendium of single-cell mRNA seq data coupled with visualizations and query abilities designed to expedite the process of biological discovery from single-cell mRNA seq experiments. We aim to augment research by providing an intuitive web interface for browsing single-cell mRNA seq experiments and a seamless connection from browsing to analysis through a RESTful API. Also under development is a cell type labeling app geared to ease the burden of manual annotation and creation of publication quality figures for newly generated data.

MISCE: A Minimum Information About a Stem Cell Experiment
MISCE, or Minimum Information about a Stem Cell Expriment, is a spreadsheet that attempts to collect a rich set of useful information (metadata) about any experiment involving stem cells. The hope is that in using MISCE, the detailed metadata will make the experimental data useful to others attempting to use it in the future.
MISCE consists of a number of different modules with each module describing a different experimental process, e.g. celluar reprogramming or RNA sequencing, and all of the important information related to this process, e.g. "Biosample disease stage" or "Assay platform". Each module can be included or excluded based on the type of experiment being performed. For example, you might not include the "Assay_DNAMethyl" module if you are not performing DNA methylation assays as part of your experiment.
Northstar: Leveraging Previous Annotations to Label New Datasets
Northstar is a computational package that can be used to apply cell type labels to a dataset by leveraging previously annotated datasets. Cells can be assigned new cell type labels or added to previously annotated cell types. Northstar also provides a number of pre-labeled cell atlases covering organs such as pancreas, liver, and more.

NDEx: The Network Data Exchange
NDEx, the Network Data Exchange, is an online commons where scientists can upload, share, and publicly distribute networks. Networks in NDEx receive globally unique accession IDs and can be stored for private use, shared in pre-publication collaboration, or released for public access.

NS-Forest: Necessary and Sufficient Forest (NS-Forest) for Cell Type Marker Determination
Necessary and Sufficient Forest is a method that takes cluster results from single cell/nuclei RNAseq experiments and generates lists of minimal markers needed to define each cell type cluster
.
The method begins by re-encoding the cluster labels into binary classifications, and Random Forest models are generated comparing each cluster versus all. The top fifteen genes are then reranked using a score measuring how binary they are, e.g., a gene with expression in the target cluster but no expression in the other clusters would have a high binary score. Expression cutoffs for the top six genes ranked by binary score are then determined by generating individual decision trees and extracting the decision path information. Then all permutations of the top six most binary genes are evaluated using f-beta score as an objective function (the beta value default set at 0.5, which weights the f-measure score more toward precision as opposed to recall)